File I/O
Learning Objectives
- Python text file IO
- Tabular data Numpy and common gotchas
- Look ahead to Pandas
What is IO?
Typing strings and numbers into an IPython Notebook are great ways to learn basics, but sooner or later you will have to learn how to read data from a file, perform some analysis on that data and ideally save the analysis.
File is a named location on disk to store related information. It is used to permanently store data in a non-volatile memory (e.g. hard disk). Since, random access memory (RAM) is volatile which loses its data when computer is turned off, we use files for future use of the data.
When we want to read from or write to a file we need to open it first. When we are done, it needs to be closed, so that resources that are tied with the file are freed. Hence, in Python, a file operation takes place in the following order.
- Open a file
- Read or write (perform operation)
- Close the file
Shell commands
Before opening out data, it's really useful to be able to have a quick look using shell commands. Luckily Jupyter Notebooks have support mor many common commands:
!head -2 "data/titanic.csv"
PassengerId,Pclass,Name,Sex,Age,SibSp,Parch,Ticket,Fare,Cabin,Embarked
892,3,"Kelly, Mr. James",male,34.5,0,0,330911,7.8292,,Q
IO for text files
Theopen() function returns a file object, and is most commonly used with two arguments: open(filename, mode). mode can be r when the file will only be read, w for only writing (an existing file with the same name will be erased), and a opens the file for appending; any data written to the file is automatically added to the end.
To read a file’s contents, call f.read(size), which reads some quantity of data and returns it as a string.
f = open("data/titanic.csv,mode = 'r',encoding = 'utf-8')
print(type(f))
Read a file line-by-line
We can use readline() method to read individual lines of a file. This method reads a file till the newline, including the newline character
f.readline()
In contrast to most text, in the world of data, lines often have a a critical significance (e.g they an individual record).
The following examples show how we could extract individual lines and store them in a list.
f = open("data/titanic.csv", mode = 'r')
#We can read a file line-by-line using a for loop.
lines = []
for line in f:
    lines.append(f)
print(len(lines))
It's even simpler to use the readlines()
f = open("data/titanic.csv", mode = 'r')
lines = f.readlines()
print(len(lines))
Closing a File
When we are done with operations to the file, we need to properly close it. Python has a garbage collector to clean up unreferenced objects. But we must not rely on it to close the file. Closing a file will free up the resources that were tied with the file and is done using the close() method.
However, this method is not entirely safe. If an exception occurs when we are performing some operation with the file, the code exits without closing the file. The best way to do this is using the with statement. This ensures that the file is closed when the block inside with is exited. We don't need to explicitly call the close() method. It is done internally.
with open("data/titanic.csv",encoding = 'utf-8') as f:
    lines = f.readlines()
print(len(lines))
f.read()
ValueErrorTraceback (most recent call last)
<ipython-input-5-103dd8a3d451> in <module>()
      2     lines = f.readlines()
      3 print(len(lines))
----> 4 f.read()

ValueError: I/O operation on closed file.
Tabular data with Numpy
The last section showed how files can be read into Python as strings. What about when our data is numeric? In previous lessons we have looked at the case of importing .csv files with purely numeric data. In this case the numpy methods np.loadtxt or np.genfromtxt can easily turn our data in a numer numpy array. np.genfromtxt is a more robust version of loadtxt that can better handle missing data.
If our csv file contains both characters and numbers, as in the current example, the situation is a little more challenging. First, let's try the naive approach:
data = np.genfromtxt("data/titanic.csv", delimiter=",")
...
ValueError: Some errors were detected !
    Line #2 (got 12 columns instead of 11)
    Line #3 (got 12 columns instead of 11)
...
This failed because the column headers have a 11 rows while the data appears to have 12 rows...have a think about why that is. If we ignored the header we can successfully import the data:
data = np.genfromtxt("data/titanic.csv", delimiter=",", skip_header=1)
data.shape
(418, 12)
data[0, :]
array([  8.92000000e+02,   3.00000000e+00,              nan,
                    nan,              nan,   3.45000000e+01,
         0.00000000e+00,   0.00000000e+00,   3.30911000e+05,
         7.82920000e+00,              nan,              nan])
Unfortunately this is still not that a great solution. Our strings have become nans and our array has 12 colums because it interpreted the comma inside the name field as a column delimiter. without resorting to even more complexity, it may be easiest at this stage to tell np.genfromtxt exactly which columns we want to use, thereby creating a purely numeric array:
data = np.genfromtxt("data/titanic.csv", delimiter=",", skip_header=1, usecols=tuple((0,1,5,6,7,8,9)))
data[0,:]
array([  8.92000000e+02,   3.00000000e+00,   3.45000000e+01,
         0.00000000e+00,   0.00000000e+00,   3.30911000e+05,
         7.82920000e+00])
This is fine, and if you definitely want to use the numpy package, it may be the easiest way to get just the numeric data out of a delimited plain txt file (i.e a csv ). But if your data consists of both number and characters, there is a more applicable package available in Python...
Mixed tabular Pandas
While we don't use the Pandas library in this course, it's useful to get a feel for what Pandas is, what types of data it can handle, and show how easy it is to read these in...
import pandas as pd
# For .read_csv, always use header=0 when you know row 0 is the header row
df = pd.read_csv("data/titanic.csv", header=0)
Okay, that seemed to work pretty well. Pandas was even clever enough to interpret the comma in the names field as a data value, rather than a delimiter. Well done Pandas.
Let's have a quick look at some out of the box tools available in Pandas:
df.info()
<class 'pandas.core.frame.DataFrame'>
RangeIndex: 418 entries, 0 to 417
Data columns (total 11 columns):
PassengerId    418 non-null int64
Pclass         418 non-null int64
Name           418 non-null object
Sex            418 non-null object
Age            332 non-null float64
SibSp          418 non-null int64
Parch          418 non-null int64
Ticket         418 non-null object
Fare           417 non-null float64
Cabin          91 non-null object
Embarked       418 non-null object
dtypes: float64(2), int64(4), object(5)
memory usage: 36.0+ KB
There's a lot of useful info there! You can see immediately we have 418 entries (rows), and for most of the variables we have complete values (418 are non-null). But not for Age, or fare, Cabin -- those have nulls somewhere.
df.describe()
| PassengerId | Pclass | Age | SibSp | Parch | Fare | |
|---|---|---|---|---|---|---|
| count | 418.000000 | 418.000000 | 332.000000 | 418.000000 | 418.000000 | 417.000000 |
| mean | 1100.500000 | 2.265550 | 30.272590 | 0.447368 | 0.392344 | 35.627188 |
| std | 120.810458 | 0.841838 | 14.181209 | 0.896760 | 0.981429 | 55.907576 |
| min | 892.000000 | 1.000000 | 0.170000 | 0.000000 | 0.000000 | 0.000000 |
| 25% | 996.250000 | 1.000000 | NaN | 0.000000 | 0.000000 | NaN |
| 50% | 1100.500000 | 3.000000 | NaN | 0.000000 | 0.000000 | NaN |
| 75% | 1204.750000 | 3.000000 | NaN | 1.000000 | 0.000000 | NaN |
| max | 1309.000000 | 3.000000 | 76.000000 | 8.000000 | 9.000000 | 512.329200 |
This is also very useful: pandas has taken all of the numerical columns and quickly calculated the mean, std, minimum and maximum value. Convenient! But also a word of caution: we know there are a lot of missing values in Age, for example. How did pandas deal with that? It must have left out any NaNs from the calculation. So if we start quoting the "average age on the Titanic" we need to caveat how we derived that number.
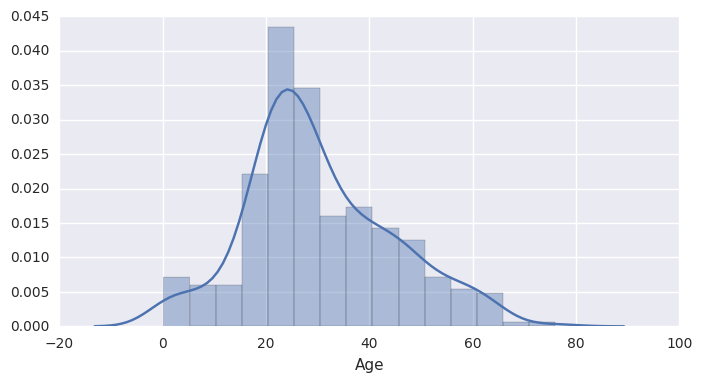
Quick plots with Pandas and seaborn
Now we have a data frame, let's quickly look at couple of quick plots we can create by passing our dataframe into Seaborn.
import seaborn as sns
sns.set(rc={"figure.figsize": (8, 4)}); np.random.seed(0)
ax = sns.distplot(df['Age'].dropna())
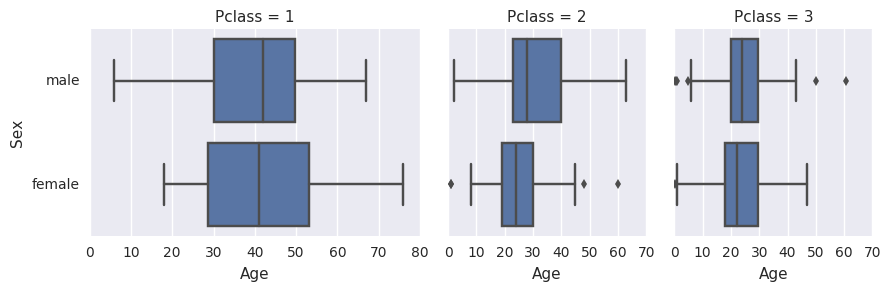
g = sns.FacetGrid(df, col="Pclass", sharex=False,
                  gridspec_kws={"width_ratios": [5, 3, 3]})
g.map(sns.boxplot, "Age", 'Sex');
Encoding
When working with files in text mode, it is recommended to specify the encoding type. Files are stored in bytes in the disk, we need to decode them when we read into Python. Similarly, encoding is performed while writing texts to the file. The default encoding is platform dependent. In windows, it is 'cp1252' but 'utf-8' in Linux. Hence, we must not rely on the default encoding otherwise, our code will behave differently in different platforms. Thus, this is the preferred way to open a file for reading in text mode.